A spectrum analyzer shows you the frequency content of your audio in real time: low frequencies on the left, high frequencies on the right, and how much energy sits at each one shown by height. It’s one of the most useful visual tools in mixing, because it lets your eyes confirm what your ears suspect — and catch problems your monitoring might hide.
Used well, it speeds up mixing and improves your decisions. Used badly, it tempts you to “mix with your eyes.” Here’s how to use it the right way.
What a spectrum analyzer actually shows
The horizontal axis is frequency in hertz (Hz), usually from about 20 Hz up to 20 kHz, displayed on a logarithmic scale so the bass region isn’t squashed. The vertical axis is level in dB. The moving graph tells you where energy is concentrated:
- Low end (20–250 Hz): kick, bass, weight, rumble.
- Low mids (250–500 Hz): body and warmth, but also mud.
- Mids (500 Hz–2 kHz): presence of most instruments and vocals.
- High mids (2–6 kHz): attack, definition, sibilance.
- Highs (6–20 kHz): air, sparkle, cymbals.
Many analyzers are built into EQ plugins (such as FabFilter Pro-Q, TDR Nova, or your DAW’s stock EQ), so you can see and fix at the same time. If you’re shopping for one, several of the best EQ plugins include a high-quality analyzer view. Standalone meters like Voxengo SPAN are also popular and free.
How to read it without mixing with your eyes
The golden rule: your ears lead, the analyzer confirms. A graph can’t tell you what sounds good — it just shows what’s there. Use it to answer specific questions:
- Is there a sharp, narrow spike that won’t go away? That’s likely a resonance.
- Is the whole low end piling up below 100 Hz? You may have a mud or rumble problem.
- Does a mix lack high-end energy compared with a reference? Maybe it’s dull.
Setting up the analyzer before you trust it
A meter is only honest if it’s reading the right signal in a sensible way. Before you draw any conclusions from the graph, get these basics right:
- Place it on the right point in the chain. On a single track it tells you about that source; on the master bus it tells you about the whole mix. Be clear about which question you’re asking, because the two graphs answer very different ones.
- Match the resolution to the job. A higher FFT size (more bands) gives you fine detail in the low end where problem resonances hide, but it reacts more slowly. A smaller size responds faster but blurs neighbouring frequencies together. Use high resolution for hunting resonances, lower for watching overall balance.
- Mind the loudness. Louder signals sit higher on the display, which can make a quiet, well-balanced mix look thin and a hot one look full. Judge shape and tilt, not absolute height, unless you’ve level-matched against your reference.
Practical uses while mixing
Finding problem resonances
A persistent narrow peak often points to a ringing resonance — a boxy room tone, a honky guitar note, a harsh cymbal. Sweep a narrow EQ band to that frequency, confirm by ear, then cut a few dB. This works hand in hand with the techniques in our EQ and compression fundamentals guide.
Managing the low end
Bass problems are hard to hear, especially in untreated rooms or on headphones. An analyzer helps you see if your kick and bass are fighting in the same range — a classic clash worth tackling with the steps in our guide to mixing kick and bass together — or if there’s subsonic rumble below 30 Hz you should high-pass away. It’s also a useful second opinion when you shape the bass on its own. This is one area where the meter genuinely compensates for imperfect monitoring — a real concern covered in our acoustic treatment guide.
Comparing to reference tracks
Load a commercial track you admire in the same genre and watch its spectral shape. You’re not trying to copy it exactly, but the overall tilt — how much low, mid, and high energy — is a useful target. Picking the right song to compare against matters, so it’s worth understanding what makes a good reference track in mixing. This is especially valuable during mastering, where overall tonal balance is everything.
Spotting clashing instruments
When two sources sound muddled together but fine in solo, the analyzer often reveals why: they’re piling energy into the same band. Watch the graph as you mute and unmute each one. If a vocal and a synth pad both peak around the same low-mid region, a small cut in the less important part — or a touch of EQ to carve out space for the other — usually clears the congestion faster than reaching for volume.
A simple workflow for everyday mixing
You don’t need to stare at the meter the whole time. A light, repeatable routine keeps it useful without letting it take over:
- Mix with your ears first and only open the analyzer when something feels wrong but you can’t place it.
- Use a slow average to judge overall balance, then switch to a fast response to chase a specific transient or resonance.
- Make the EQ move, then look away from the screen and confirm the decision by listening alone.
- Once a section sounds right, compare its broad shape to a reference, level-matched, before moving on.
Display settings that matter
- Slope/tilt: music naturally has more low-frequency energy, so most analyzers apply a tilt (often around 4.5 dB/octave) so a well-balanced mix looks roughly flat. Know your meter’s default.
- Averaging/peak hold: a fast response shows transients; a slower average shows the overall balance. Use averaging for tonal decisions.
- Pre/post EQ: when the analyzer is in an EQ, decide whether you’re viewing the signal before or after your moves.
Common mistakes to avoid
- Chasing a flat line. A flat spectrum is not the goal; a good-sounding mix is. Genres have their own shapes.
- EQing every peak you see. Many peaks are musical and meant to be there. Only act on what you can also hear as a problem.
- Ignoring your ears. If it sounds great and looks odd, trust the sound.
- Comparing at different volumes. A louder reference will always look bigger and brighter. Level-match before you read anything into the difference.
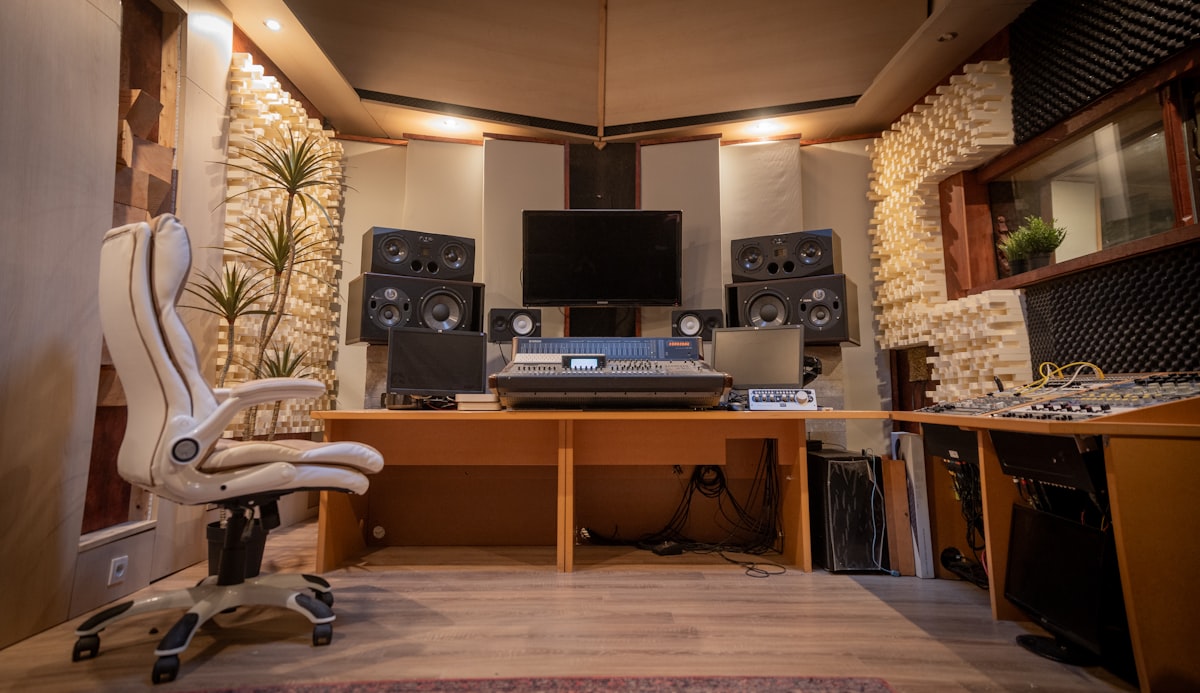
Untreated rooms and closed-back cans are exactly where the graph earns its keep, so it pairs especially well with the habits in our guide to mixing on headphones. For the bigger picture on routing and processing your sessions, see our mixing and mastering hub.
Frequently asked questions
Do I need a spectrum analyzer to mix well?
No, but it helps a lot, especially in an untreated room or on headphones where your ears can be fooled. Treat it as a confirmation tool, not a replacement for listening.
What’s a good free spectrum analyzer?
Voxengo SPAN is a widely used free standalone analyzer. Many free and stock EQ plugins also include a built-in analyzer, so you can see and adjust frequencies in one window.
Why does my mix look bass-heavy on the analyzer?
Music naturally carries more low-frequency energy, so an untilted analyzer always looks bass-heavy. Enable your meter’s tilt/slope setting, then compare against a reference track in the same genre rather than judging the raw shape.
Should I use a spectrum analyzer on every track?
It’s not necessary, and it can slow you down. Reach for one when a specific problem resists your ears — a hidden resonance, a low-end clash, or a mix that won’t translate — rather than running it as a constant overlay on every channel.